
Top Manufacturing Reporting Dashboard Solutions for 2026
Why Most Manufacturers Are Flying Blind With Their Own Data
Manufacturing reporting tools are software solutions that pull operational and financial data from ERP systems, shop floor processes, and other sources — then turn that data into dashboards, reports, and alerts that help plant teams make faster, smarter decisions.
Here's a quick breakdown of the most common tool categories:
Tool Type Best For Key Limitation Native ERP reporting Basic transactional queries Rigid, slow, requires IT General BI platforms (Tableau, Power BI) Flexible visualization No manufacturing context built in Specialized manufacturing reporting tools Shop floor + financial KPIs Varies by ERP compatibility Mobile/shop floor reporting apps Real-time operator data capture Narrow scope CMMS reporting modules Maintenance and asset tracking Limited to maintenance data AI-powered analytics platforms Natural language queries, predictions Higher cost, data readiness required
Most manufacturers aren't short on data. They're short on useful data — at the right time, in the right hands.
Here's what's actually happening on the shop floor right now: production numbers live in the ERP, scrap data is on a whiteboard, labor costs are estimated (not tracked), and the ops manager is spending hours every week stitching spreadsheets together just to answer basic questions like "Did we hit our shipping target yesterday?" or "Where is our margin leaking?"
It doesn't have to work this way.
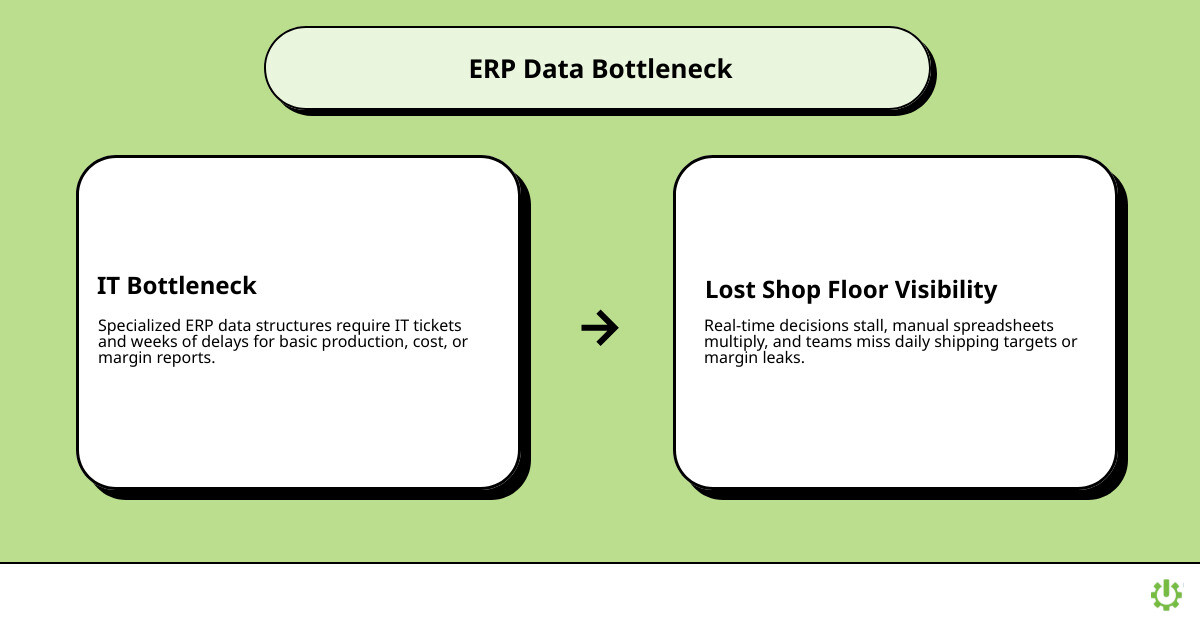
The core problem is access. Getting cost accounting data, BOM variance reports, or machine performance trends out of a typical ERP system requires specialized knowledge of its data structures. That creates a bottleneck — usually IT — that slows every decision down. By the time a report is ready, the moment to act has already passed.
The shift to modern manufacturing reporting tools is about removing that bottleneck entirely. It means giving operations managers, plant supervisors, and quality engineers direct visibility into live data — without writing SQL, submitting IT tickets, or waiting ten weeks for a custom report. One real-world example from the research captures it well: a process engineer needed a specific report to troubleshoot a production issue, went through IT, and after multiple rounds of revisions and roughly ten weeks of delays, ended up solving the problem another way. That's the status quo for too many plants.
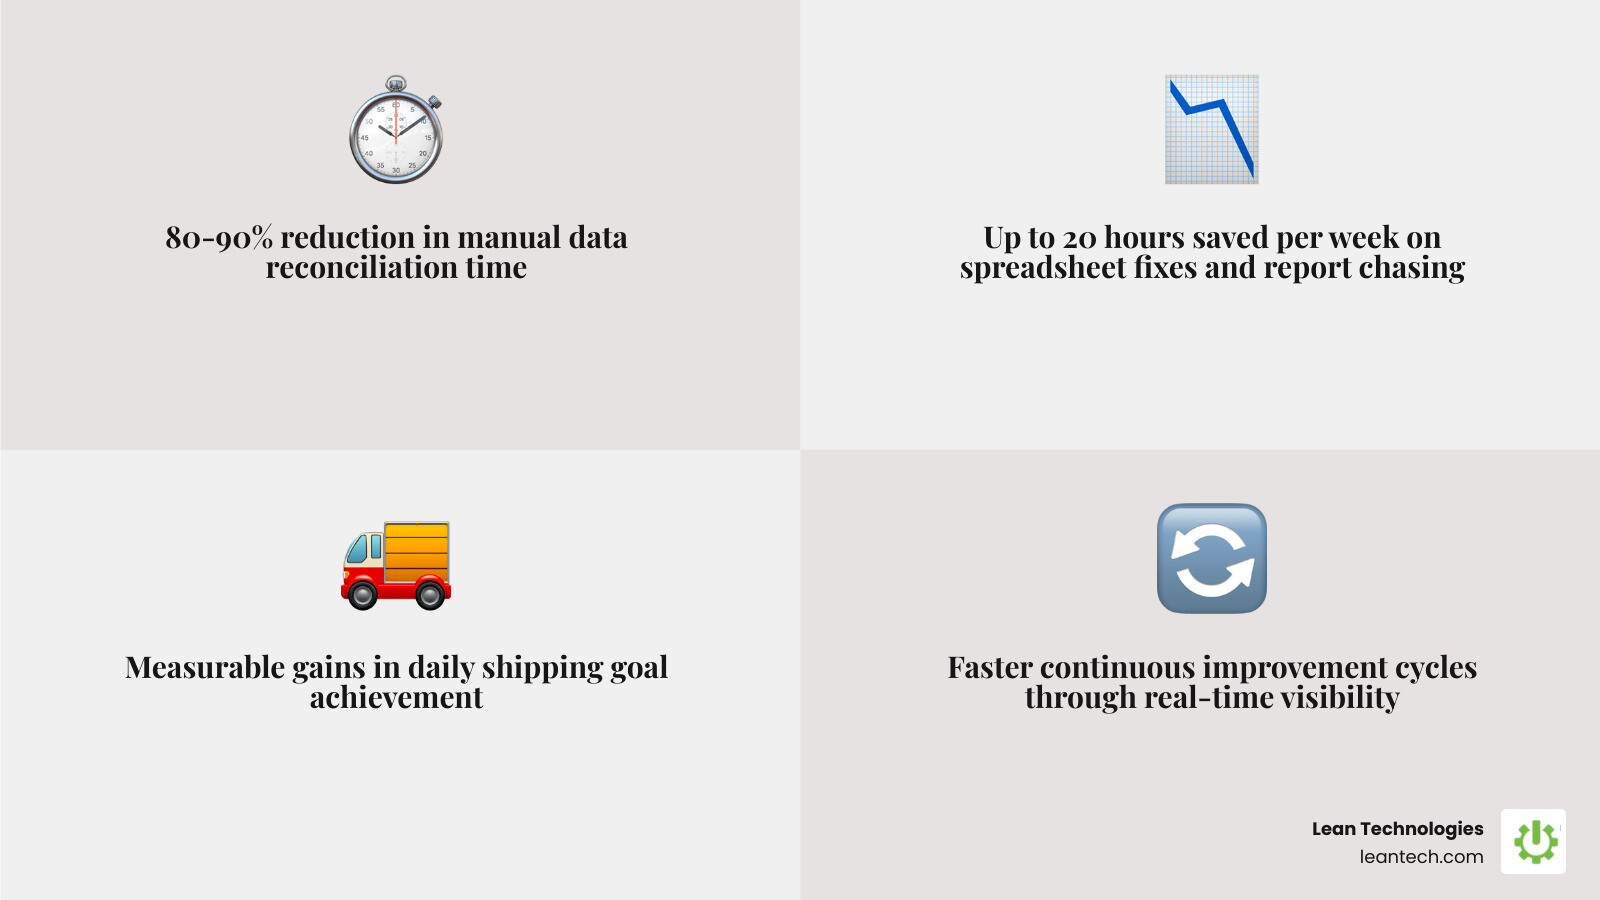
The good news: the right reporting tools can eliminate 80–90% of manual reconciliation work, save teams 20+ hours of data entry every week, and give supervisors the real-time visibility they need to hit daily shipping targets and catch problems before they become costly.
This guide covers the top manufacturing reporting dashboard solutions for 2026 — what to look for, what to avoid, and how to find the right fit for your plant.
What manufacturers actually need from manufacturing reporting tools
Most plants do not need "more dashboards." They need faster answers.
That usually means pulling together ERP transactions, labor data, quality records, maintenance history, inventory movement, and shop floor updates into one view that people can actually use. Good manufacturing reporting tools help teams answer questions like:
Why did this work order run over standard?
Where is scrap increasing by shift, machine, or material?
Which jobs are hurting gross margin?
Are PM gaps putting uptime at risk?
Is inventory turning fast enough, or just collecting dust like an expensive paperweight?
For manufacturers, the highest-value reporting sits at the intersection of financial and operational data. That is where BOM variance, routing variance, labor tracking, inventory turns, supplier cost changes, bottlenecks, and margin analysis all show up together.
Why native ERP reports often fall short
ERP systems are good at storing transactions. They are not always good at making those transactions easy to analyze.
Common problems include:
Data spread across multiple ERP modules
Rigid report formats that are hard to change
Security models that make access messy
Heavy reliance on technical users
Slow turnaround for custom report requests
Limited drill-down across modules
This is especially painful in manufacturing because the answers rarely live in one table or one screen. A supervisor might need production order details, labor, scrap, material usage, and inventory effects in a single report. Native ERP tools often make that harder than it should be.
For a good overview of how manufacturing-focused reporting platforms approach this problem, see Manufacturing Reporting, Analytics, & Dashboard Solutions .
Why generic BI platforms create extra work
General BI tools are powerful, but they often create a new project before they create a useful report.
They usually require:
Data modeling from scratch
Manual KPI definitions
Someone who understands manufacturing data logic
Ongoing analyst support
More governance work to avoid conflicting numbers
That is why teams often end up with beautiful dashboards and very slow answers. If no one agrees on how scrap, OEE, labor variance, or first-pass yield is calculated, the dashboard becomes decoration.
What good manufacturing reporting tools do differently
The best manufacturing reporting platforms close the gap between ERP data and shop floor action. They typically offer:
Prebuilt manufacturing KPIs
Real-time or near-real-time refresh
Drill-down to live transactions
Role-based dashboards for operations, finance, quality, and maintenance
Mobile-friendly views for supervisors and operators
Exception alerts for misses, delays, or rising variance
Self-service reporting without heavy IT support
They also support the reality of manufacturing: data does not only come from the ERP. It may also come from MES, CMMS, spreadsheets, operator entries, and other systems. Strong tools combine those sources into a single usable picture.
Top manufacturing reporting tools features to compare in 2026

When comparing solutions in 2026, manufacturers should not ask, "Can it make charts?" Almost everything can make charts.
They should ask, "Can it help the plant act faster with less manual work?"
Here is a practical comparison:
Capability Native ERP Reporting Manufacturing Reporting Tools General BI Tools Manufacturing KPIs out of the box Limited Strong Limited Cross-module ERP reporting Often difficult Designed for it Possible, but manual Drill-down to transactions Basic Strong Depends on setup Real-time shop floor visibility Weak Strong Depends on integrations Self-service for business users Limited Strong Moderate Mobile usability Often poor Usually better Varies Multi-source integration Limited Strong Strong, but manual IT dependence High Lower Moderate to high Security and role-based views ERP-only Usually strong Varies
Real-time and drill-down capabilities that drive action
Real-time reporting matters because "end of shift" is often too late. If scrap spikes at 9:15 a.m., waiting until tomorrow's spreadsheet is not reporting. It is archaeology.
The best tools support:
Live dashboards for production, quality, maintenance, and shipping
Drill-down from KPI to work order, batch, machine, or transaction
Variance analysis by shift, product, routing step, or operator
Work order status visibility
Bottleneck identification while production is still running
This is also where mobile and MES-connected reporting shine. For more on MES reporting and operational vs historical analysis, see Manufacturing Software | MES Reporting & Analytics .
Self-service manufacturing reporting tools for business users
One of the biggest shifts in 2026 is the move from IT-built reports to business-user reporting.
That includes:
No-code or low-code report builders
Plain-English query interfaces
Excel-friendly access where needed
Reusable templates for common reports
Faster dashboard changes without waiting in an IT queue
This matters because manufacturing teams often cannot wait weeks for a report tweak. If a quality engineer needs a trend by material lot and machine, or a plant manager wants to compare downtime by line and shift, they should not need a developer to get there.
Integration, security, and deployment requirements
Modern platforms also need to fit the plant's tech stack, not demand a rip-and-replace project.
Key requirements include:
ERP integration
Support for MES, CMMS, quality, and spreadsheet inputs
Cloud, hybrid, or on-premise deployment options
Role-based access and audit trails
Multi-site standardization
Governance so everyone works from the same definitions
Manufacturers evaluating broader analytics platforms may also want to review Manufacturing Analytics and Reporting Software - m-Power for examples of multi-source reporting and mobile access.
The most valuable dashboards and reports for plant teams

The most useful reports are not the fanciest. They are the ones plant teams actually check every day.
For many manufacturers, that means a mix of production, quality, maintenance, labor, and cost dashboards. Visual management still matters too, especially when tied to action. That is why digital Performance Goal Boards and searchable Work Order History can be so valuable alongside reporting dashboards.
Financial and cost reports that expose waste
Cost visibility is usually where reporting projects earn their keep.
High-value financial reports include:
Cost of goods manufactured
Gross margin by product, customer, or job
BOM and material cost variance
Supplier cost trends
Scrap cost by line, part, or shift
Inventory carrying cost
Cash flow and overdue vendor views
These reports help finance and operations speak the same language. Instead of arguing over totals, they can see where costs are actually leaking.
Production and quality dashboards supervisors use daily
These are the dashboards supervisors and CI leaders tend to live in:
BOM variance
Routing variance
Scrap trend by machine, shift, or material
Defect trend by cause or product family
Throughput vs target
OEE
Downtime by reason code
First-pass yield
Schedule adherence
Shipping status
For teams focused on direct improvement work, tools like Defect & Scrap Tracking and Workflow Tracking can help turn dashboard signals into actual follow-up.
Maintenance, inventory, and labor reports that protect uptime
Maintenance and labor reporting often get ignored until something breaks. Then everyone suddenly cares very deeply.
Useful reports here include:
PM compliance
Maintenance backlog
Work order aging
Spare parts usage and stockout risk
Labor by operation or routing step
Actual vs standard job time
Asset downtime trend
Cycle count accuracy
Inventory exceptions
For plants trying to reduce downtime and tighten execution, PM Gap Report and Leader Standard Work are useful internal next steps.
How reporting tools reduce costs and improve shop floor performance
The best reporting tools do not create value because they are "digital." They create value because they cut delay, expose waste, and improve accountability.
That shows up in several ways:
Less manual reconciliation
Fewer spreadsheet errors
Better labor tracking
Faster response to scrap and downtime
Tighter inventory control
Stronger schedule adherence
Better maintenance follow-through
Faster continuous improvement cycles
Where the ROI shows up first
In many plants, the first wins are administrative.
Research shows that automated manufacturing reporting can:
Eliminate 80-90% of manual reconciliation work
Save 20 hours of manual data entry per week
Reduce spreadsheet handling and duplicate entry
Shorten reporting cycles and monthly close support
Cut rework caused by bad or late data
There are also operational benefits. In one example from the research, real-time reporting and dashboard visibility supported a 100% daily shipping goal. That matters because shipping misses are rarely caused by one big issue. They are usually caused by dozens of small issues that were not visible early enough.
How mobile and shop-floor reporting improve visibility
Mobile reporting helps because it captures data at the source, when the work happens.
That includes:
Operation-step reporting from handhelds or tablets
Labor start/stop capture in real time
Quantity completed by operation
Immediate supervisor visibility into progress
Faster escalation when jobs stall
This is especially important when ERP screens are too clunky for the shop floor. A simple mobile interface often leads to better data quality because operators actually use it. And if data gets entered days later, it is no longer real-time. It is historical fiction.
How AI adds the next layer
AI is starting to make reporting faster and easier, but it works best when the underlying data is clean and structured.
Useful AI features include:
Natural language report creation
Anomaly detection
Assisted root cause analysis
Auto-generated executive summaries
Faster exception spotting across lines, shifts, or suppliers
AI can help a plant manager ask, "Show scrap rate by machine and material for the last quarter," without building the report manually. It can also surface patterns that humans might miss. But AI is not magic dust. If the plant still runs half the process on paper and the other half in conflicting spreadsheets, AI will simply deliver bad answers faster.
How to evaluate the best-fit solution for your ERP environment
Choosing a reporting platform is not about buying the most features. It is about picking the system your team will actually use.
For small to midsize manufacturers, the best-fit solution usually combines:
Fast time to value
Good ERP compatibility
Strong operational dashboards
Easy user adoption
Reasonable total cost of ownership
Flexible deployment
Clear governance and security
It should also support the work beyond the report. If a dashboard identifies a problem, the team still needs a way to assign actions, track follow-up, and close the loop.
Questions to ask before buying
Before selecting a tool, manufacturers should ask:
Does it integrate with the current ERP without custom heroics?
Can it combine ERP, MES, maintenance, quality, and manual inputs?
How easy is it for non-technical users to build or edit reports?
Does it support real-time dashboards and historical trends?
Can users drill from summary KPIs into transaction detail?
What mobile experience does it offer for supervisors and operators?
Are audit trails and role-based permissions built in?
How long does implementation usually take?
What training is required?
How will ROI be measured after go-live?
Red flags to avoid
Some warning signs show up early:
Reporting only at summary level with no drill-down
Heavy dependence on IT or outside consultants
Weak mobile usability
No manufacturing context in the data model
Custom-code dependence for every change
Poor support for cross-functional metrics
No clear governance for KPI definitions
If every dashboard request becomes a mini software project, the tool is already creating friction.
Best-fit checklist for small to midsize manufacturers
For small and midsize plants, simple usually wins.
A strong shortlist should include solutions that support:
Fast rollout
Operator-friendly forms and dashboards
Action tracking, not just reporting
Continuous improvement workflows
Maintenance and quality visibility
Project and task tracking
Easy board-style management views
That is where a platform like Lean Technologies' Thrive can stand out. It is not trying to replace ERP or MES. It helps teams structure work, capture issues in real time, and drive follow-through so reporting leads to action instead of another meeting about why the numbers are late.
For manufacturers looking to connect reporting with execution, these internal tools are worth exploring:
Frequently Asked Questions about manufacturing reporting tools
What are the biggest challenges with ERP reporting in manufacturing?
The biggest challenges are ERP complexity, cross-module data, and slow access. Manufacturing answers often require data from production, inventory, purchasing, labor, and finance at the same time. Native ERP reports can be rigid, technical, and heavily dependent on IT. That leads to delayed reports and inconsistent numbers.
How do manufacturing reporting tools differ from BI tools?
Manufacturing reporting tools are built around manufacturing logic. They usually include prebuilt KPIs, operational workflows, and role-based views for plant teams. General BI tools are more flexible, but they often require manual data modeling, dashboard setup, and more analyst support before they become useful.
Can manufacturing reporting tools work with existing ERP and MES systems?
Yes. Most modern tools are designed to integrate with existing ERP systems and, in many cases, MES, CMMS, and other plant data sources. The best ones support phased rollout, multi-source integration, and role-based security so teams can improve visibility without replacing core systems.
What to do next
The best manufacturing reporting tools do more than show metrics. They help teams see problems earlier, assign action faster, and keep improvements moving.
That is the real goal: not prettier dashboards, but better execution.
For manufacturers that want real-time visibility tied to structured work, accountability, and digital lean processes, Lean Technologies offers a practical path forward with Thrive. It gives plant teams one place to track issues, projects, workflow, maintenance follow-up, and shop floor execution without turning the plant into a science experiment.
Helpful next steps:
Explore project management
Review the main Lean Technologies site at https://leantech.com/
See how digital maintenance support fits at https://leantech.com/maintenance
Stop managing the shop floor through spreadsheets and wishful thinking. Better visibility is how better plants run.